
Reports overview
The Reports page collects six pre-built reports on your revenue, membership, and day-to-day operations. Every report exports to CSV or PDF and can be emailed on a schedule — there’s no report builder to configure, just open a card and read.
Reports are read-only summaries of data you’re already collecting, so there’s nothing to set up first: they fill in as members join, pay, book, and check in.
The catalog
Section titled “The catalog”Click Reports in the sidebar. The catalog groups the six reports into three categories:
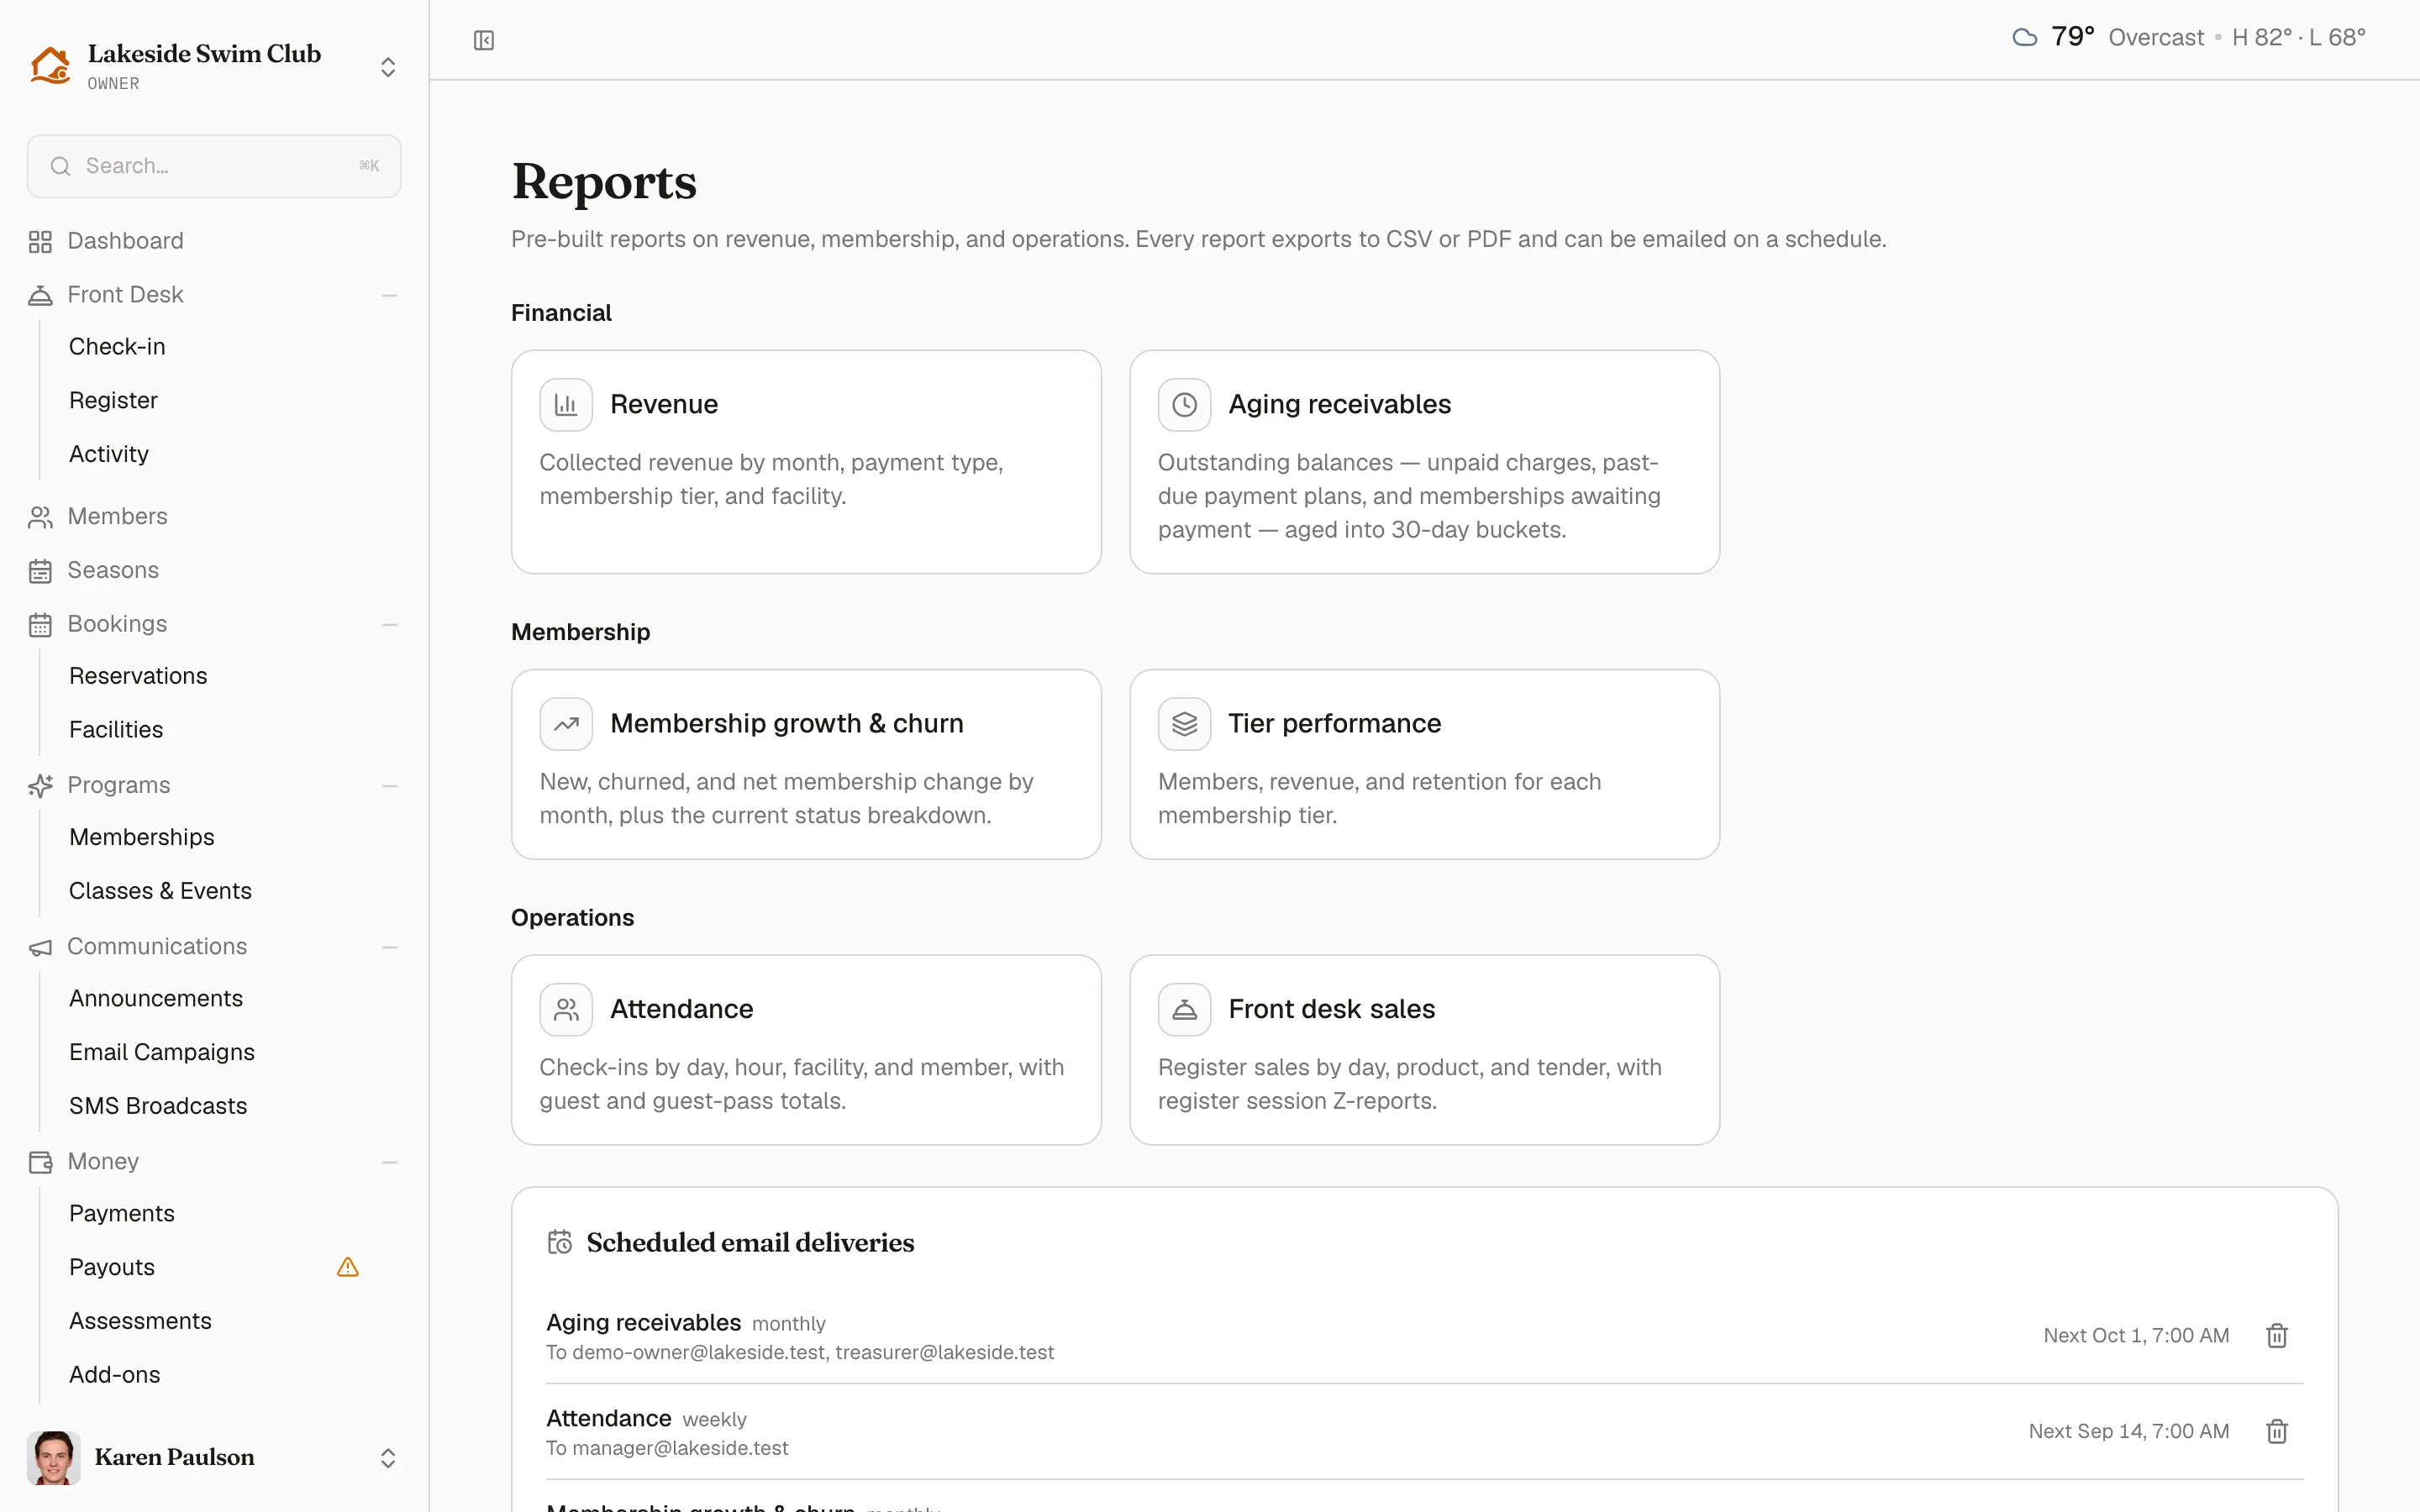
| Report | Category in the app | What it shows | Documented on |
|---|---|---|---|
| Revenue | Financial | Collected revenue by month, payment type, membership tier, and facility. | Financial reports |
| Aging receivables | Financial | Everything you’re owed, aged into 30-day buckets. | Financial reports |
| Front desk sales | Operations | Register sales by day, product, and tender. | Financial reports |
| Membership growth & churn | Membership | New, churned, and net membership change by month. | Membership reports |
| Tier performance | Membership | Members, revenue, and retention for each membership tier. | Membership reports |
| Attendance | Operations | Check-ins by day, hour, facility, and member. | Membership reports |
These docs split the six reports across two pages by what they answer — money on one, people on the other — which doesn’t line up exactly with the app’s three catalog categories. The two Operations reports are documented alongside the questions they belong to: Front desk sales with the money reports, Attendance with the membership reports.
Which reports you see
Section titled “Which reports you see”Two reports depend on modules from your plan:
- Attendance requires the Front Desk & Check-in module — without check-in data there is nothing to report.
- Front desk sales requires the Point of Sale module.
If your organization doesn’t have the module, the card simply doesn’t appear in the catalog. The other four reports run on base-plan data and are always available.
Run a report and pick a date range
Section titled “Run a report and pick a date range”- Click Reports, then click a report card.
- Use the Date range picker in the header, then click Apply. You can’t pick dates in the future.
Reports that aggregate by month — Revenue, Membership growth & churn, and Tier performance — default to the last six months. Day-level reports — Attendance and Front desk sales — default to the last 30 days.
Aging receivables is the exception: it’s a snapshot of what you’re owed right now, so it has no date range picker at all.
Export to CSV or PDF
Section titled “Export to CSV or PDF”Click CSV or PDF in the report header. The export honors whatever date range is applied and contains every table the report shows on screen — a CSV stacks the tables one after another, each with its title and column headers. Files are named after the report and range, like revenue-2026-02-01-to-2026-08-05.csv.
Scheduled email deliveries
Section titled “Scheduled email deliveries”The card at the bottom of the Reports page lists every scheduled delivery in your organization — which report, how often, who receives it, and when it next goes out. Click the trash icon on a row to stop a delivery. To set one up, open a report and click Schedule email — see Scheduled email reports.